kapitel-24maple.mw
Mathematik
von T. Arens, F. Hettlich, Ch. Karpfinger, U. Kockelkorn, K. Lichtenegger, H. Stachel
(zu Kapitel 24: Funktionen mehrerer Variablen)
Vektorwertige Funktionen in mehreren Veraenderlichen
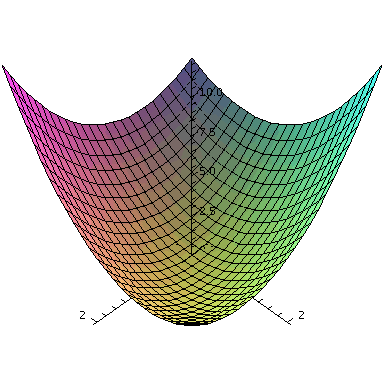
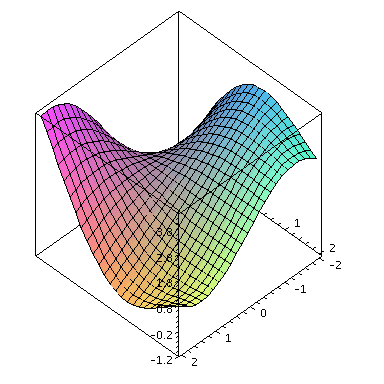
Skalarwertige Funktionen in mehreren Variablen koennen wie gewohnt entweder in Form von Ausdruecken oder als Funktionen in Maple eingeben werden, etwa
Der Befehl
plot3d
zeigt uns den Graphen dieser Funktion.
| > |
plot3d(f,-2..2,-2..2,axes=normal); |
Drehen wir das Bild, so erhalten wir eine gute Vorstellung von der Flaeche. Durch die verschiedenen
Optionen
(hier z.B. axes = fuer die Darstellung des Koordinatinesystems) bieten sich Moeglichkeiten an, das Bild den eigenen Wuenschen entsprechend zu erstellen. Durch Umlenken der Ausgabe (
interface
) oder die Auswahl Export, bei Verwendung der rechten Maustaste auf dem Bild, koennen solche Bilder in verschiedenen Formaten gespeichert werden.
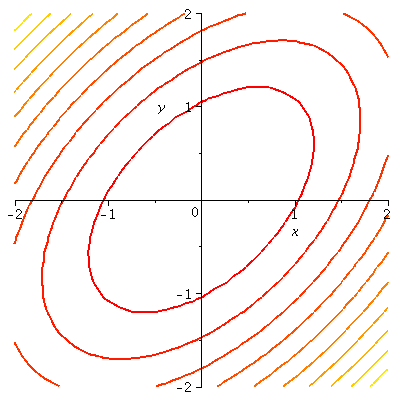
Die Konturlinien einer Funktion in mehreren Variablen koennen wir uns auch anzeigen lassen, mit dem Befehl
contourplot
, der im plots Paket implementiert ist.
| > |
with(plots):
contourplot(f(x,y),x=-2..2,y=-2..2,contours=10,scaling=constrained, thickness=2); |
Mit Optionen, lassen sich die Anzahl der Konturlinien oder die Niveaus, die Linienstaerke, die Skalierung, die Farbe und vieles mehr einstellen.
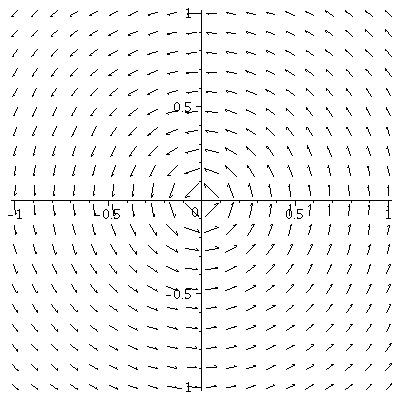
Der Befehl
fieldplot
liefert uns eine anschauliche Darstellung von Vektorfeldern
g:  ->
-> 
| > |
g1:=(x,y)->-y/(x^2+y^2)^(5/8);
g2:=(x,y)->x/(x^2+y^2)^(5/8);
fieldplot([g1,g2],-1..1,-1..1,scaling=constrained); |
Um die partiellen Ableitungen von f zu ermitteln, koennen wir wiederum den Operator D bzw bei Ausdruecken diff verwenden. Selbsverstaendlich muss angegeben werden, nach welcher Variablen differenziert werden soll. Beim Operator D durch den Index der Variablen und bei Ausdruecken durch den Namen der Variablen. Auch hoehere Ableitungen lassen sich so bestimmen.
bzw.
| > |
diff(f(x,y),y); diff(f(x,y),x,y); |
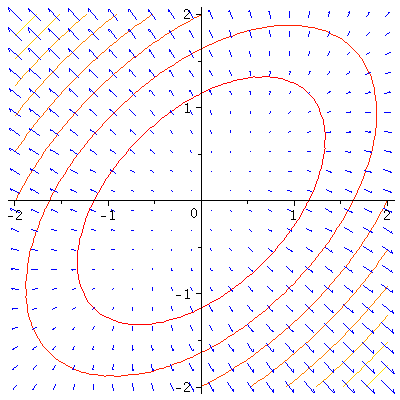
Nun laesst sich etwa in den Konturplot der Funktion auch der Gradient mit einzeichnen.
| > |
p1:=contourplot(f,-2..2,-2..2,thickness=1):
p2:=fieldplot([D[1](f),D[2](f)],-2..2,-2..2,thickness=1,color=blue,scaling=constrained):
display(p1,p2);
|
und wir bekommen einen Eindruck davon, dass der Gradient stets senkrecht auf den Hoehenlinien steht.
Im Paket linalg sind einige Differentialoperatoren fest implementiert. So koennen wir etwa den Gradienten von f durch folgenden Befehl berechnen lassen.
| > |
with(linalg):
grad(f(x,y),[x,y]); |
Dabei muss das erste Argument der Funktionsausdruck sein und das zweite Argument enthaelt eine Liste oder einen Vektor der Variablen. Beachten Sie, dass im Gegensatz zur Konvention im Buch Vektoren in Maple im allgemeinen als Zeile notiert werden.
Sobald die betrachteten Funktionen vektorwertig werden, koennen wir entweder komponentenweise vorgehen oder wir nutzen Felder um die Funktionen einzugeben, etwa
| > |
f:=(x)->vector([x[1]^2+x[2]^2,x[1]*x[2]]); |
Analog zum Gradienten ist auch die Jakobimatrix im linalg Paket schon als Operation vorgegeben.
| > |
J:=jacobian(f(x),[x[1],x[2]]); |
Dabei ist das erste Argument ein vektorwertiger Ausdruck und das zweite Argument wiederum eine Liste der Variablen. Das Ergebnis ist nun vom Typ Matrix.
Moechten wir den Vektor bestehend aus den Ableitungen nach einer bestimmten Variablen erzeugen, so koennen wir den Befehl
map
verwenden, der die angegebene Operation auf jede Komponente anwendet.
Das erste Argument bezeichnet den Operator, das zweite das komponentenweise zu differenzierende Feld, und das dritte Argument gibt das zweite Argument fuer diff an, die Variable nach der differenziert werden soll.
Implizit gegebene Funktionen
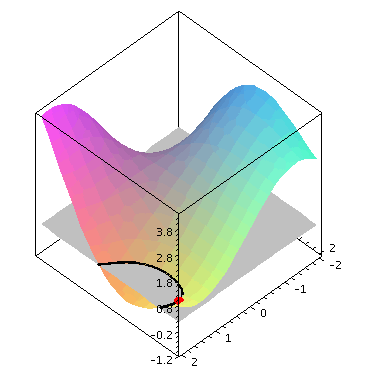
Wir versuchen uns den Satz ueber implizit gegebene Funktionen mit den graphischen Moeglichkeiten von Maple klar zu machen. Als Beispiel dient die Funktion
| > |
f:=(x,y)-> -y*sin(x)-x*cos(y)+Pi/2;
|
mit ihrem Graphen
| > |
plot3d(f,-2..2,-2..2,axes=boxed); |
Nun betrachten wir das Niveau  , also den Schnitt des Graphen mit der Ebene
 ![x[3] = 0](images/kapitel-24maple_23.gif) .
.
| > |
with(plots):
with(plottools):
p1:=plot3d(f,-2..2,-2..2,axes=boxed,style=patchnogrid):
p2:=plot3d(g,-2..2,-2..2,color=gray,style=patchnogrid):
p3:=plot3d(f,-2..2,-2..2,style=contour,contours=[0.0],thickness=3,color=black):
p4:=sphere([Pi/2,Pi/2,0],0.1,style=patchnogrid,color=red):
display(p1,p2,p3,p4); |
Als Punkt auf diesem Niveau sei ![(x[0], y[0], 0) = (`+`(`*`(`/`(1, 2), `*`(Pi))), `+`(`*`(`/`(1, 2), `*`(Pi))), 0)](images/kapitel-24maple_26.gif) gegeben. Zur Kontrolle:
gegeben. Zur Kontrolle:
Da
| > |
D[1](f)(Pi/2,Pi/2);
D[2](f)(Pi/2,Pi/2); |
gilt, liefert der Satz ueber implizit gegebene Funktionen, dass lokal um den Punkt (![x[0]](images/kapitel-24maple_30.gif) ,
, ![y[0]](images/kapitel-24maple_31.gif) ) die schwarz eingezeichnete Niveaulinie als Funktion
) die schwarz eingezeichnete Niveaulinie als Funktion  geschrieben werden kann. Da
  = 0](images/kapitel-24maple_33.gif) gilt, kann es aber keine Funktion
gilt, kann es aber keine Funktion  geben. Dies ist anschaulich offensichtlich, wenn das obige Bild so gedreht wird, dass wir von oben auf die
  ,
, - Ebene sehen, und wir den Verlauf der schwarzen Kurve beim roten Punkt betrachten.
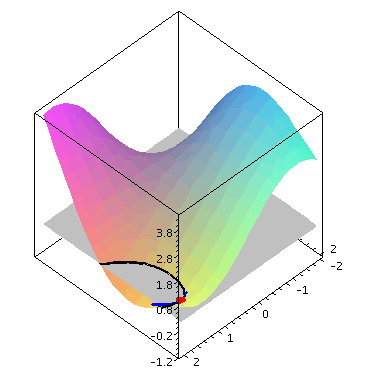
Weiter koennen wir implizit differenzieren, um die Ableitungen der Funktion y(x) in der Stelle (![x[0], y[0]](images/kapitel-24maple_37.gif) ) zu bestimmen. Damit laesst sich die schwarz gezeichnete Niveaulinie, die wir explizit nicht kennen, zumindest in einer Umgebung des roten Punktes durch ein Taylorpolynom approximieren. Im naechsten Plot ist der Graph des Taylorpolynoms vom Grad zwei gezeigt (blaue Kurve),
) zu bestimmen. Damit laesst sich die schwarz gezeichnete Niveaulinie, die wir explizit nicht kennen, zumindest in einer Umgebung des roten Punktes durch ein Taylorpolynom approximieren. Im naechsten Plot ist der Graph des Taylorpolynoms vom Grad zwei gezeigt (blaue Kurve),
 =
= ![y(x[0])](images/kapitel-24maple_39.gif) +
+  '(
'(![x[0]](images/kapitel-24maple_41.gif) ) (
) (![`+`(x, `-`(x[0]))](images/kapitel-24maple_42.gif) ) +
) + 
 ''(
''(![x[0]](images/kapitel-24maple_45.gif) )
) ![`*`(`^`(`+`(x, `-`(x[0])), 2))](images/kapitel-24maple_46.gif) .
.
Zunaechst berechnen wir die Ableitungen aus den Gleichungen
| > |
dy:=solve(D[1](f)(Pi/2,Pi/2) + D[2](f)(Pi/2,Pi/2)*dy=0,dy); |
und
| > |
ddy:=solve(D[1,1](f)(Pi/2,Pi/2) + 2*D[1,2](f)(Pi/2,Pi/2)*dy + D[2,2](f)(Pi/2,Pi/2)*dy^2 +
D[2](f)(Pi/2,Pi/2)*ddy=0,ddy); |
Somit erhalten wir
| > |
p1:=plot3d(f,-2..2,-2..2,axes=boxed,style=patchnogrid):
p2:=plot3d(g,-2..2,-2..2,color=gray,style=patchnogrid):
p3:=plot3d(f,-2..2,-2..2,style=contour,contours=[0.0],thickness=3,color=black):
p4:=sphere([Pi/2,Pi/2,0],0.1,style=patchnogrid,color=red):
p5:=spacecurve([t,Pi/2+Pi/(4-2*Pi)*(t-Pi/2)^2,0],t=Pi/2-1/2..Pi/2+1/2,color=blue,thickness=3):
display(p1,p2,p3,p4,p5); |
Bemerkung: Der Befehl
implictdiff
bietet die Moeglichkeit einen Ausdruck implizit zu differenzieren.
Das Newton-Verfahren
Um etwa beim Minimieren die Nullstellen des Gradienten zu finden, sind Nullstellen von vektorwertigen Funktionen gesucht. Wie im Buch gezeigt, laesst sich das Newton-Verfahren auf diese Situation verallgemeinern. Wir erweitern unser Programm zum Newton-Verfahren. Da die allgemeine vektorwertige Formulierung aufwändiger ist, behandeln wir den eindimensionalen Fall separat. Im folgenden Vorschlag ist dies durch eine Fallunterscheidung realisiert.
| > |
newtappr := proc (f, x0, N)
local i, n, xn, fp, fpxn, h, lall;
xn := x0;
if (type(x0,'float') or type(x0,'algnum')) then
fp := D(f);
lall := xn;
for i to N do
xn := xn - f(evalf(xn))/fp(evalf(xn));
lall := lall, xn
od;
elif (type(x0,'vector')) then
n := linalg[vectdim](x0);
fp := linalg[jacobian](f(x),vector([seq(x[j],j=1..n)]));
lall := [evalf(evalm(xn))];
for i to N do
fpxn := subs({seq(x[j]=evalf(xn[j]),j=1..n)},evalm(fp));
h := linalg[linsolve](fpxn,evalm(-f(evalf(xn))));
xn := evalm(xn + h);
lall := [op(lall), evalm(xn)];
od;
else
print(`wrong type of variable`)
end if;
lall;
end: |
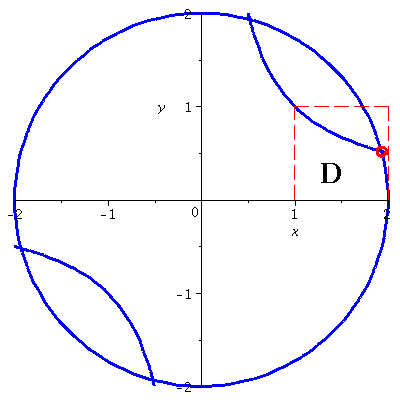
Nun testen wir das Programm im vektorwertigen Fall. Dazu waehlen wir das Gleichungssytem
![`+`(`*`(`^`(x[1], 2)), `*`(`^`(x[2], 2))) = 4](images/kapitel-24maple_50.gif) ,
,
![`*`(x[1], `*`(x[2])) = 1](images/kapitel-24maple_51.gif)
in der Menge D =[1,2] x [0,1] . Wir schreiben das System als Nullstellenproblem, etwa
| > |
f:=x->vector([x[1]^2+x[2]^2-4, x[1]*x[2]-1]); |
Anschaulich bedeutet die Aufgabe, dass wir einen bestimmten Schnittpunkt von zwei Kurven suchen.
| > |
p1:=contourplot(f(vector([x,y]))[1],x=-2..2,y=-2..2,contours=[0.0],thickness=3,color=blue,scaling=constrained):
p2:=contourplot(f(vector([x,y]))[2],x=-2..2,y=-2..2,contours=[0.0],color=blue,thickness=3):
p3:=circle([sqrt(2+sqrt(3)),1/sqrt(2+sqrt(3))],0.05,color=red,thickness=3):
p4:=line([1,0],[1,1],color=red,linestyle=DASH):
p5:=line([1,1],[2,1],color=red,linestyle=DASH):
p6:=line([2,1],[2,0],color=red,linestyle=DASH):
p7:=textplot([1.4,0.3,'D'],font=[COURIER,BOLD,22]):
display(p1,p2,p3,p4,p5,p6,p7); |
Mit dem Startpunkt (1,0) und dem Newton-Verfahren ergibt sich
| > |
newtappr(f,vector([1.,0.]),10); |
Auch wenn das Newton-Verfahren sicherlich die verbreiteste und in vielen Faellen sinnvollste Methode zur numerischen Loesung nichtlinearer Gleichungssysteme ist, sprechen wir hier noch einen anderen Weg an. Im Kapitel 28 wird der Banachsche Fixpunktsatz bei Differenzialgleichungssystemen genutzt. Die Aussage zur sukzessiven Approximation koennen wir aber auch einfach nutzen um Gleichungssysteme zu loesen. Dazu formulieren wir das Problem der Nullstellen von  um zu einer Fixpunktgleichung, etwa fuer die Funktion
| > |
g:=x->vector([x[1]-1/4*(x[1]^2+x[2]^2-4), x[2]-1/4*(x[1]*x[2]-1)]); |
In dem oben rot eingezeichneten Quadrat ist  eine Selbstabbildung und kontrahierend. Eine sukkzessive Approximation approximiert somit auch die Loesung
| > |
sukzappr := proc (g, x0, N)
local i, xn, lall;
xn := x0;
lall:=[evalf(evalm(xn))];
for i to N do
xn := evalf(evalm(g(xn)));
lall := [op(lall), evalm(xn)];
od;
lall;
end: |
| > |
sukzappr(g,vector([1,1]),20); |
Offensichtlich konvergiert diese Methode erheblich langsamer (es handelt sich nur um eine Konvergenz erster Ordnung). Andererseits ist eine Fixpunktiteration allgemeiner, da keine Ableitungen benoetigt werden und solche Verfahren mit nur groben Naeherungen als Startwerte auskommen, um zu konvergieren.
Extrema
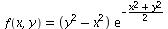
Bei der Suche nach Extrema einer Funktion in mehreren Variablen, sind Nullstellen des Gradienten gesucht. Mit dem Newton-Verfahren koennen wir nun auch zum Beispiel bei der Funktion f mit
aus Aufgabe 25.23 die Extrema berechnen.
| > |
f:=(x,y)->(y^2-x^2)*exp(-(x^2+y^2)/2); |
Dazu betrachten wir den Gradienten:
| > |
g:=linalg[grad](f(x[1],x[2]),[x[1],x[2]]);
g1 := g[1];
g2 :=g[2]; |
und definieren uns dieses Vektorfeld als eine Funktion
MIt dem oben geschriebenen Programm zum Newton-Verfahren ergibt sich
| > |
newtappr(g,vector([1.,0.]),10); |
Starten wir an einer anderen Stelle, so wird eventuell eine der anderen Nullstellen approximiert. Das Verfahren divergiert, wenn mit einem ungeigneten Startwert begonnen wird. Dies ist nicht ueberraschend, denn die Theorie sichert nur eine lokale Konvergenz in einer Umgebung einer Nullstelle.
| > |
newtappr(g,vector([0,1.0]),10);
newtappr(g,vector([-1.,1.]),30); |
Maple bietet mit dem
solve
Befehl auch die Moeglichkeit algebraisch Loesungen zu mehrdimensionalen Gleichungen zu suchen. Wir erhalten:
| > |
solve({g1=0,g2=0},{x[1],x[2]}); |
Beachten Sie die Syntax. Es muessen die Gleichungen und die Variablen als Mengen angeben werden. Mit
evalf
koennen wir uns die Wurzeln anzeigen lassen:
Aufgaben
1. Bestimmen Sie die Jakobimatrizen zu folgenden Funktionen
a) ![f(x[1], x[2], x[3]) = `+`(`/`(`*`(3, `*`(x[3])), `*`(sin(`+`(`-`(x[1]), `*`(2, `*`(x[2])), x[3])))))](images/kapitel-24maple_105.gif)
b) 
Loesung
2. Bestimmen Sie mit dem Newton-Verfahren eine Stelle x mit x=g(x) (einen Fixpunkt) der Funktion
![g(x) = `*`([`+`(cos(x[1]), `-`(sin(x[2]))), `+`(cos(x[1]), `-`(`*`(2, `*`(sin(x[2])))))], `/`(1, 4))](images/kapitel-24maple_107.gif) .
.
Loesung